Apples to Apples: Which Camera Technologies Work Best for Beam Profiling Applications
Part 4: Scanning Slit vs Camera-Based Beam Analyzers

In part 1, we discussed camera technologies that are available for covering various wavelengths. There are similar options for scanning slit profilers. Germanium detectors cover the NIR and Telecom wavelengths, and pyroelectric detector scan heads can be used in the mid and far IR regions.

Author:

G.E. Slobodzian, Director of Engineering, Retired, Ophir-Spiricon

  • Part 1: New Camera Technologies
  • Part 2: Baseline Methods and Mode Effects
  • Part 3: Beam Aperturing Methods

For those readers who are not familiar with scanning slit technology, a brief description of how they operate is provided. Below is a pictorial of how our Photon NanoScan2 (NS2) scanning slit system acquires the intensity profile of a laser beam.

Figure 4-1. The inner workings of a Photon Scanning Slit Scan Head.

The slit is mounted on a rotating drum that turns on an axis that is oriented at 45° to the X/Y axial directions. The slits are mounted + and - 45° to the drum axis. As the drum rotates, the slits slip thru the beam in the X and Y axial directions. Sampling the signal passing thru the moving slits and digitizing it creates a beam profile consisting of integrated vertical (X) and horizontal (Y) slices thru the beam.

The resulting beam profiles are not 2D representations of the beam intensity, and are unlike that generated by a camera. However the integrated rows and column slices can be used to compute the beam's second moment D4s and 13.5% of Peak (D%ms) beam widths. When BeamGage® computes the D%ms method, it emulates the above scanning slits by summing the rows and columns of pixels and then applying the 13.5% clip level to compute the ISO moving slit measurement. The 13.5% clip level is positioned well above the noise floor, so it is fairly immune to background baseline noise and offset. However, it is impacted by baseline offset if the offset is great enough. As we demonstrated in Part 2, the D%ms method is reasonably stable over a large range of degrading signal to noise conditions.

The D4s calculations are once again the more difficult one to get right, even with a scanning slit. As we learned in parts 2 and 3, you need both a stable baseline and a well-placed aperture to isolate the beam. In a scanning slit system the baseline must be calculated on-the-fly from (dark) signal outside the slit scanning area. This dark value is then subtracted, on-the-fly, from the scanned region to establish a baseline.

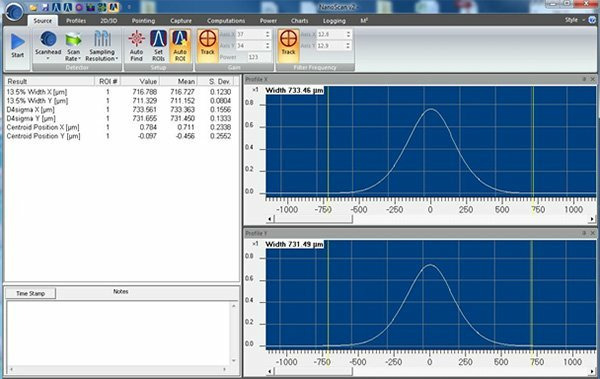
To isolate the beam an aperture is computed that brackets the slit profile on the right and the left. The Photon isolating aperture is referred to as an ROI… not to be confused with a camera ROI, which is something different. The method for calculating the Photon ROI is not the same as the 3x method recommended by ISO, but achieves the same, if not better, results. The Photon Auto ROI method (the yellow bars shown below) yields a closer fitting aperture, similar to the Spiricon 2x Auto Aperture.

Figure 4-2. Basic Display of the Photon NanoScan v2 Software.

Large Beam Comparison

In Figure 4-2, the X and Y scanned profiles are displayed with their corresponding ROI limits indicated by the yellow bars. The computed results with 16 frame sample statistics can be seen on the left. The 13.5% Width X/Y values are the same as the D%ms results in the camera based system. The "%ms" indicates the 13.5% of Peak Moving Slit method. The D4sigma X/Y results are equivalent to the same D4s results that were previously computed in the camera based system.

In Figure 4-2 you can observe that the aperture method is set to Auto ROI, and the Gain and Filter Frequency are both set to auto Track.

In the following graphs, the NanoScan2 scan head is operating at its default 10Hz scanning rate with 0.0912μm sampling resolution. Figure 4-3 compares the measurement of the HeNe from Part 3 between the NanoScan2 and the SP620 camera. The bold lines are the results obtained with the NanoScan2, while the fine lines are from the X/Y beam width data we recorded earlier and averaged in Figures 3-6a and 3-6d. Here each X/Y beam width is displayed separately.

Figure 4-3. NS2 and SP620 Comparison.

Notice that the NS2 results are plotted over three (3) orders of magnitude of beam intensity, while the SP620 camera data is confined to essentially one (1) order of magnitude. I chose to display it this way to show the dynamic range advantage of the on-the-fly baseline subtraction method employed by the NS2 software when the Gain is set to auto Track.

While both the camera and the NS2 scan head can operate over many orders of magnitude, the camera requires a new Exposure/Gain setting and a corresponding new Ultracal to be performed for each significant change in beam intensity. The NS2 will auto adjust the gain and compute the new baseline on-the-fly.

Also noticeable in Figure 4-2 is the spread between the D4s and D%ms results, which are very similar to what was observed with the camera based system plotted in Figure 3-6c, reproduced below.

Figure 3-6c. Camera results, reproduced here.

Part of the reason why the NS2 can achieve a consistent measurement over many orders of magnitude is because the signal to noise ratio in the NS2 scan head is much higher than that of a typical CCD camera. While a CCD camera has millions of pixels, the NS2 scan head has one large single element detector. For a large silicon detector, a dynamic range of 109 is not uncommon. The NS2 silicon scan head with amplification, filtering, and digitizing has a signal to noise ratio >90dBrms at low gains, and is thus fitted with a 16bit A to D converter.

Small Beam Comparison

The scanning slit systems have the ability to measure very small focused spots. Our SP620 camera is limited to about 10 pixels, or a 44μm second moment beam width. Anything smaller and the accuracy begins to fall off. A scanning slit can measure beams to ~5x the slit width. For the common 5μm slit this is 20-25μm. For the 1.8μm slit this is about 7-9μm. This is made possible by the fact that the moving slit is actually oversampling the beam as it scans across it. This oversampling yields resolutions that are higher than what one could obtain if the samples occurred only once per slit width.

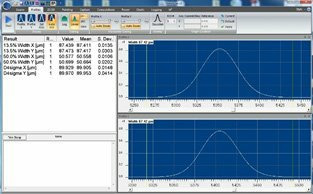
Below is a comparison of the NS2 to an SP620 camera for the above HeNe beam focused by a 75mm f.l. lens to about 90um. The focused spot is found by translating the scan head and camera manually in the caustic until the minimum spot size is obtained. The computed results and the beam profiles are shown below in Figures 4-4a thru 4-4d.

Figure 4-4a 12a. NS2 Focused Beam Results Figure 4-4b 12b. SP620 Focused Beam Results
Figure 4-4c 12c. NS2 Focused Beam Profile
Figure 4-4d 12d.. SP620 Focused Beam Profile

It's interesting to note that with the smaller spot size, the NS2 now measures the beam slightly smaller than the camera for both the D4s and the 13.5% D%ms, whereas it measured a D4s slightly larger when the beam was larger. Observe also that the standard deviation for the NS2 is about 10x better for all of the measurements, thus reflecting the superior signal to noise properties of the scanning slit system.

As in all previous measurements, the moving slit results are slightly lower than the D4s results. This may be due to the effects of noise on the D4s results, or it may be due to the fact that the moving slit method measures slightly lower in the presence of some higher order Laguerre modes which, even though are small, are still somewhat present in a typical HeNe laser.

2D Beam Profile Comparison

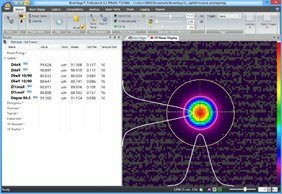
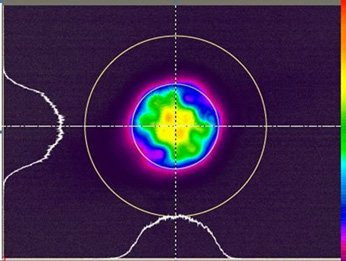
One area where the scanning slit system does not compare favorably with a camera-based product is in the ability to see a laser beam's true intensity profile. Below is one example of how a scanning slit 2D profile does not reveal what could be important to know about your laser.

Figure 4-5a.. NanoScan2 Profile with false 2D image of the beam shown in F13b.
Figure 4-5b.. Actual Camera 2D and Slice Profiles of the Beam shown in F13a.

Conclusions

Of course there are many other factors to consider when selecting between a camera-based and a scanning slit system, but it is not the intent of this paper to go into those areas in detail. Most important was to point out that similar methods need to be employed with scanning slit methods, even though the technologies are very different. We can close part 4 of this paper with the following conclusions:

  • Scanning slit based technologies can yield essentially the same results as a camera-based system.
  • Scanning slit systems must employ:
    • An appropriate baseline subtraction method
    • An isolating aperture that is ~2x the beam width The beam must be sized appropriately for the scan head design
    • Scanning slit systems have the ability to operate over many orders of magnitude of beam intensity without employing manual adjustments to the system.
    • Scanning slit systems can measure very small spot sizes with higher degrees of accuracy.
    • Camera based systems are superior if you need to actually see the beam profile.

References

  1. Carlos B Roundy, PhD; Techniques for Accurately Measuring Laser Beam Width with Commercial CCD Cameras, Spiricon, Inc., Logan, Utah 84341 USA, Presented At 4th International Workshop on Laser Beam and Optics Characterization
  2. Amiel A. Ishaaya, Nir Davidson, Galina Machavariani, Erez Hasman, and Asher A. Friesem; Efficient Selection of High-Order Laguerre–Gaussian Modes in a Q-Switched Nd :YAG Laser, IEEE JOURNAL OF QUANTUM ELECTRONICS, VOL. 39, NO. 1, JANUARY 2003
  3. CCD IMAGE SENSOR NOISE SOURCES, August 3, 2012 Reference Document Rev 1.0 PS-0047, TRUESENSE imaging, inc.
  4. Albert J.P. Theuwissen, Kleine Schoolstraat; Influence of Terrestrial Cosmic Rays on the Reliability of CCD Image Sensors, © 2005 IEEE
  5. ISO 11146-1:2005(E), Lasers and laser-related equipment —Test methods for laser beam widths, divergence angles and beam propagation ratios — Part 1:Stigmatic and simple astigmatic beams.
  6. ISO/TR 11146-3:2004(E), Lasers and laser-related equipment — Test methods for laser beam widths, divergence angles and beam propagation ratios — Part 3: Intrinsic and geometrical laser beam classification, propagation and details of test methods
  7. ISO/TR 11146-3:2004/Cor.1:2005(E), Lasers and laser-related equipment — Test methods for laser beam widths, divergence angles and beam propagation ratios — Part 3: Intrinsic and geometrical laser beam classification, propagation and details of test methods
  8. Ram Oron, Nir Davidson, Asher A. Friesem, Erez Hasman; Chapter 6 Transverse mode shaping and selection in laser resonators, E. Wolf, Progress in Optics 42 © 2001 Elsevier Science B. V
  9. 9. A. E. Siegman; How to (Maybe) Measure Laser Beam Quality, Tutorial presentation at the Optical Society of America Annual Meeting Long Beach, California, October 1997
  10. 10. Siegman, Sasnett, and Johnston; Choice of Clip Levels for Beam Width Measurements Using Knife-Edge, IEEE Journal of Quantum Electronics, Vol. 27, No. 4, April 1991
Contact Us illustration

Have questions? Require assistance?

Click below to to contact Ophir Photonics and we'll get back with you shortly.

Contact Ophir Photonics